Around 34.5 million Americans were living in poverty in 2025, according to the Census Bureau, as the official poverty rate fell from 10.7 percent to 10.2 percent. It was the second consecutive annual decline and the lowest rate recorded under the measure. Poverty among children also fell to a record-low 13.4 percent.
Median household income also increased 2.6 percent to a record $87,460. The headline figures offer one measure of how American households were faring during the first year of President Donald Trump's second term, as his administration has pointed to rising incomes and falling poverty as signs of economic improvement. "President Trump’s proven economic agenda delivered historic working-class prosperity in his first year back in office, with record-high real income and record-low poverty—breaking the records he set during his first term," White House spokesperson Olivia Wales told Newsweek regarding the figures.
"The President was reelected in a landslide victory to turn the page on Joe Biden’s inflation crisis, and he remains laser-focused on doubling down on his winning economic agenda of tax cuts, deregulation, and energy abundance here at home to drive economic prosperity for everyday Americans." The Official Poverty Measure (OPM), which is also used for the state figures below, compares a family's pretax cash income with a national poverty threshold. It does not count benefits such as SNAP or tax credits, account for medical and work expenses, or adjust for differences in housing costs across the country. The Census Bureau's broader Supplemental Poverty Measure (SPM), which incorporates those factors, stood at 13.1 percent in 2025 and was not statistically different from the previous year.
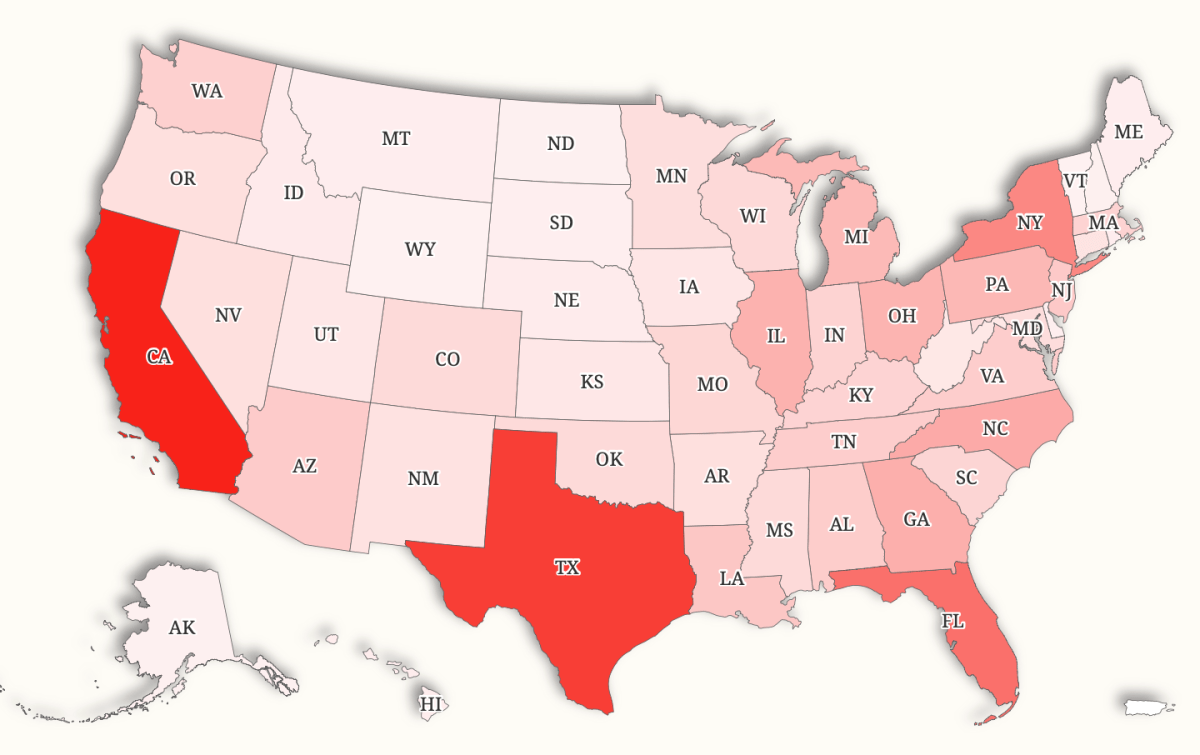
Even under the official measure, however, poverty is far from evenly distributed. The latest Census data shows millions of people living below the poverty line in the country's largest states over the last three years, while some much smaller states stand out because poverty affects a large share of residents. California had the largest number of people living in poverty under OPM, averaging about 4.17 million over the three-year period.
It was followed by Texas, with 3.61 million; Florida, 2.82 million; and New York, 2.13 million. Together, those four states account for about 12.7 million people, or roughly 36 percent of the table's national three-year average of 35.84 million. The next-highest totals were North Carolina, at 1.43 million; Georgia, 1.37 million; Illinois, 1.31 million; Ohio, 1.30 million; Pennsylvania, 1.19 million; and Michigan, 1.15 million.
California, Texas, Florida and New York are among the country's largest states by population, meaning a large poverty population does not necessarily translate into an unusually high poverty rate. Population estimates put Texas at about 31.7 million residents in 2025, for example, while New York had about 20 million. Some considerably smaller population states stand out due to the proportion of those in poverty.
Extract — continue reading at the source.